Screening orderings with the displacement atlas#
The effect-size recast reads how far each class profile drifts along an ordering of the cohort, and the specificity check compares the two timing axes against a random ordering. The displacement atlas generalises that comparison: it treats every continuous or ordered variable outside the 238 clustered features as an ordering axis, reads each class’s endpoint displacement along it, and lays the axes out as one map, sorted from the largest mover to the smallest. The two timing axes become two rows among many, judged against the same random floor.
What counts as an axis#
An axis is any proband-level variable that is continuous or ordered and is not the phenotype the
mixture was fitted on. Two families are carried in the catalogue (analysis.axes.ATLAS_AXES):
Timing axes: diagnostic era and age at diagnosis, the mechanism under test.
Covariate axes: the measurement-to-diagnosis lag, age at evaluation, household income, and the area deprivation index, together with the ordered demographic covariates the demographic screen adds (parental education, the inferred parental ages, and the ASD family-history and perinatal-complication counts).
Two roles are excluded. Ordering probands by one of the 238 clustered features, or by a total taken over them (an SCQ or RBS-R sum), would move the class centroids by construction, a circular self-drift. Held-out phenotype instruments (Vineland-3 adaptive behaviour, DCDQ motor coordination, full-scale IQ) are still phenotype, correlated with the clustered features by construction, so they are a non-null ceiling rather than a clean external ordering and are left out for the same reason.
A seeded random ordering is the floor. It is the one control guaranteed to carry no real structure, so an axis whose displacement clears it is above sampling noise. The atlas makes no covariate-orthogonality assumption: rather than pre-select controls thought to be orthogonal to timing, it reports every axis and leaves the random floor as the only reference. An axis whose join to the modelling cohort falls below the coverage floor (a thousand probands by default) is dropped and named, so a thin instrument is never read as if it were well covered.
The quantity#
For each axis the stage derives the axis’s own kernel bandwidth at the recovery floor, builds a focal grid, and reads each class’s whole-class endpoint displacement: the separation-scaled norm of the per-feature centroid shift between the axis endpoint and the pooled centroid. This is the same quantity the specificity panel reads for a single control, lifted to run over the whole catalogue. It is expressed in between-class separation units, so a value is a fraction of the mean gap between classes and is comparable across axes. No mixture is refitted; the responsibilities of the measurement-only reference stay frozen and only the kernel re-weighting changes per axis.
The map#
The stage writes displacement_atlas.parquet, one row per axis and reference class: the endpoint
displacement, the axis label and kind, and the joined sample size. The figure groups the axes into
stacked panels by kind (the timing axes, the covariate pool, and the random floor), labelled A
onward, sharing one colour scale and the class columns. Within each panel the rows run from the
largest class-summed mover to the smallest, and the random floor is the last panel.
uv run analysis displacement-atlas
uv run figures atlas
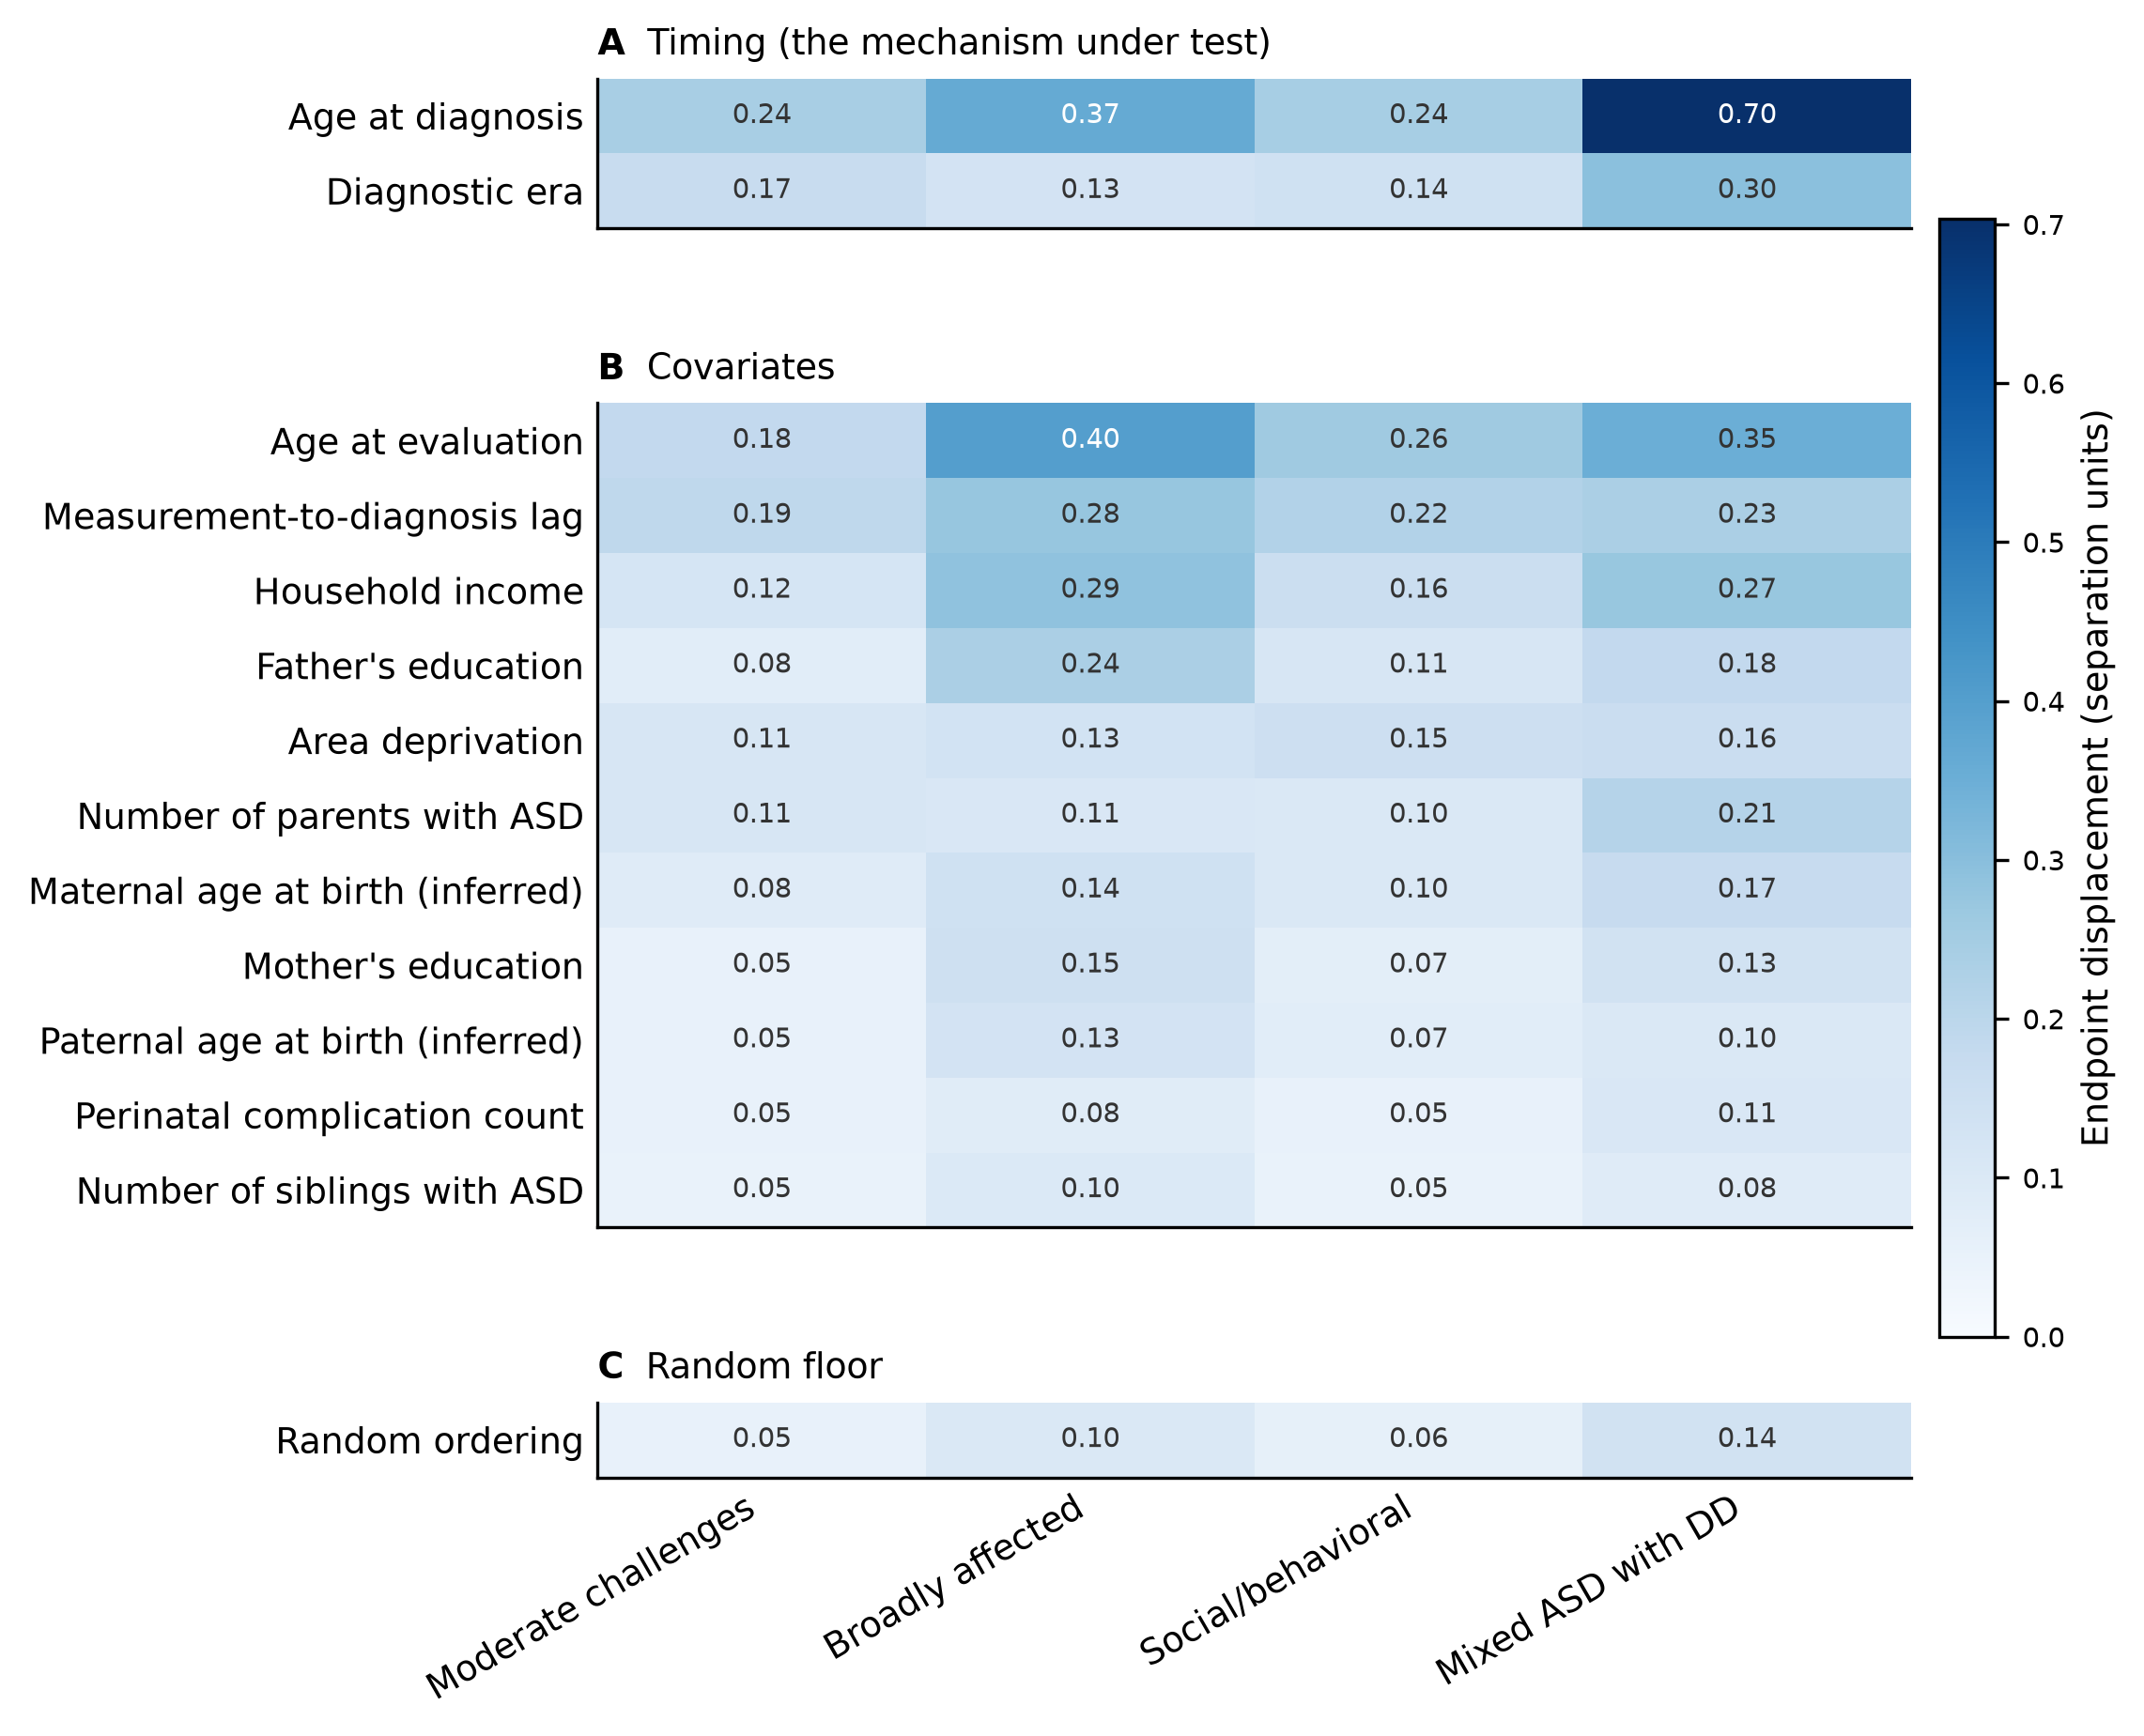
Per-class endpoint displacement (separation units) along every non-modelling ordering axis, grouped by kind into panels and sorted within each panel by the class-summed displacement. Age at diagnosis is the largest mover, led by the developmental class (Mixed ASD with developmental delay); diagnostic era sits among the covariate axes, and every axis clears the random floor in the last panel.#
Reading it#
The atlas is a screen, not a test: it ranks orderings by how much they move the classes and shows the random floor for scale. Two readings follow. Down the rows, an axis far above the floor is one the class profiles track; down to the floor is one they do not. Across the columns, the per-class pattern says which class each axis moves, the confound-robust signal that a shared dependence on the axis cannot fake: age at diagnosis concentrates on the developmental class, the same class the category decomposition and the prevalence drift single out. Diagnostic era clears the random floor but sits among the covariate axes, so its drift is above noise while no larger than a socioeconomic or measurement-timing gradient in the same classes.