Tracking the classes across the strata (refit pilot)#
Archived
This is the earlier hundred-permutation refit pilot, kept for the record. The drift question it opened is now answered by the effect-size recast (H_0^A and H_0^D: are the class profiles invariant, and is any drift small?), and its category-attribution result is \(H_0^F\).
The question
When the four-class mixture is re-estimated on its own within a stratum of age at diagnosis, or of diagnostic era, do the classes stay put? The stratified stage refits the model in each stratum, aligns the stratum classes back to the named reference, and measures how far each moved against a null that breaks only the link to the axis. This page reports the first run: both axes, one hundred permutations, under the frozen primary scheme.
The result
No stratum is an outlier: no class drifts beyond its null on either axis (0 of 44 tests on age, 0 of 40 on era, Benjamini-Hochberg at \(q = 0.05\)). Taken in order, though, the classes move a consistent young-to-old distance, past an ordering-shuffle null for all four classes on age and three of four on era. The movement is carried by the two developmental classes and the developmental features, and the membership turns over most at the extremes. This is the middle case the design anticipated, a gradual feature-driven trajectory rather than fixed classes or a broken partition. It is a pilot, not the confirmatory run.
Two tests, one answer#
The two findings only look opposed. The drift test is local: is any one stratum’s class further from the reference than a same-size random stratum? The directional test is global: from youngest to oldest stratum, do the centroids move a consistent net distance, more than a reshuffle of the order? A slow drift spread across eleven strata leaves each step within the noise while the sum is not, so the classes pass the first test and fail the second.
The drift stage reads each shift as a fraction of the between-class separation. The two least developmental classes barely move (Moderate challenges and Social or behavioral, 0.22 to 0.24 of the class gap); the two developmental classes move more (Mixed ASD with developmental delay and Broadly affected, 0.33 to 0.44). None clears the null, and the two cells that exceed the whole separation are reorganised, not moved: the Jaccard overlap there falls to 0.07, a different set of probands under the same label. Five such cells appear on age, seven on era, mostly in Broadly affected.
The run is on SPARK 2026-03-23 (11,704 probands) under the frozen primary scheme: MaxEqualBins(1000)
(11 age bins, 10 era bins), Jaccard membership alignment, Mahalanobis distance. Runs: drift 18b35b34
and 51b335b0, trajectory db8195db and 5864719e, attribution 46208ce1 and e3281c14.
The class trajectories#
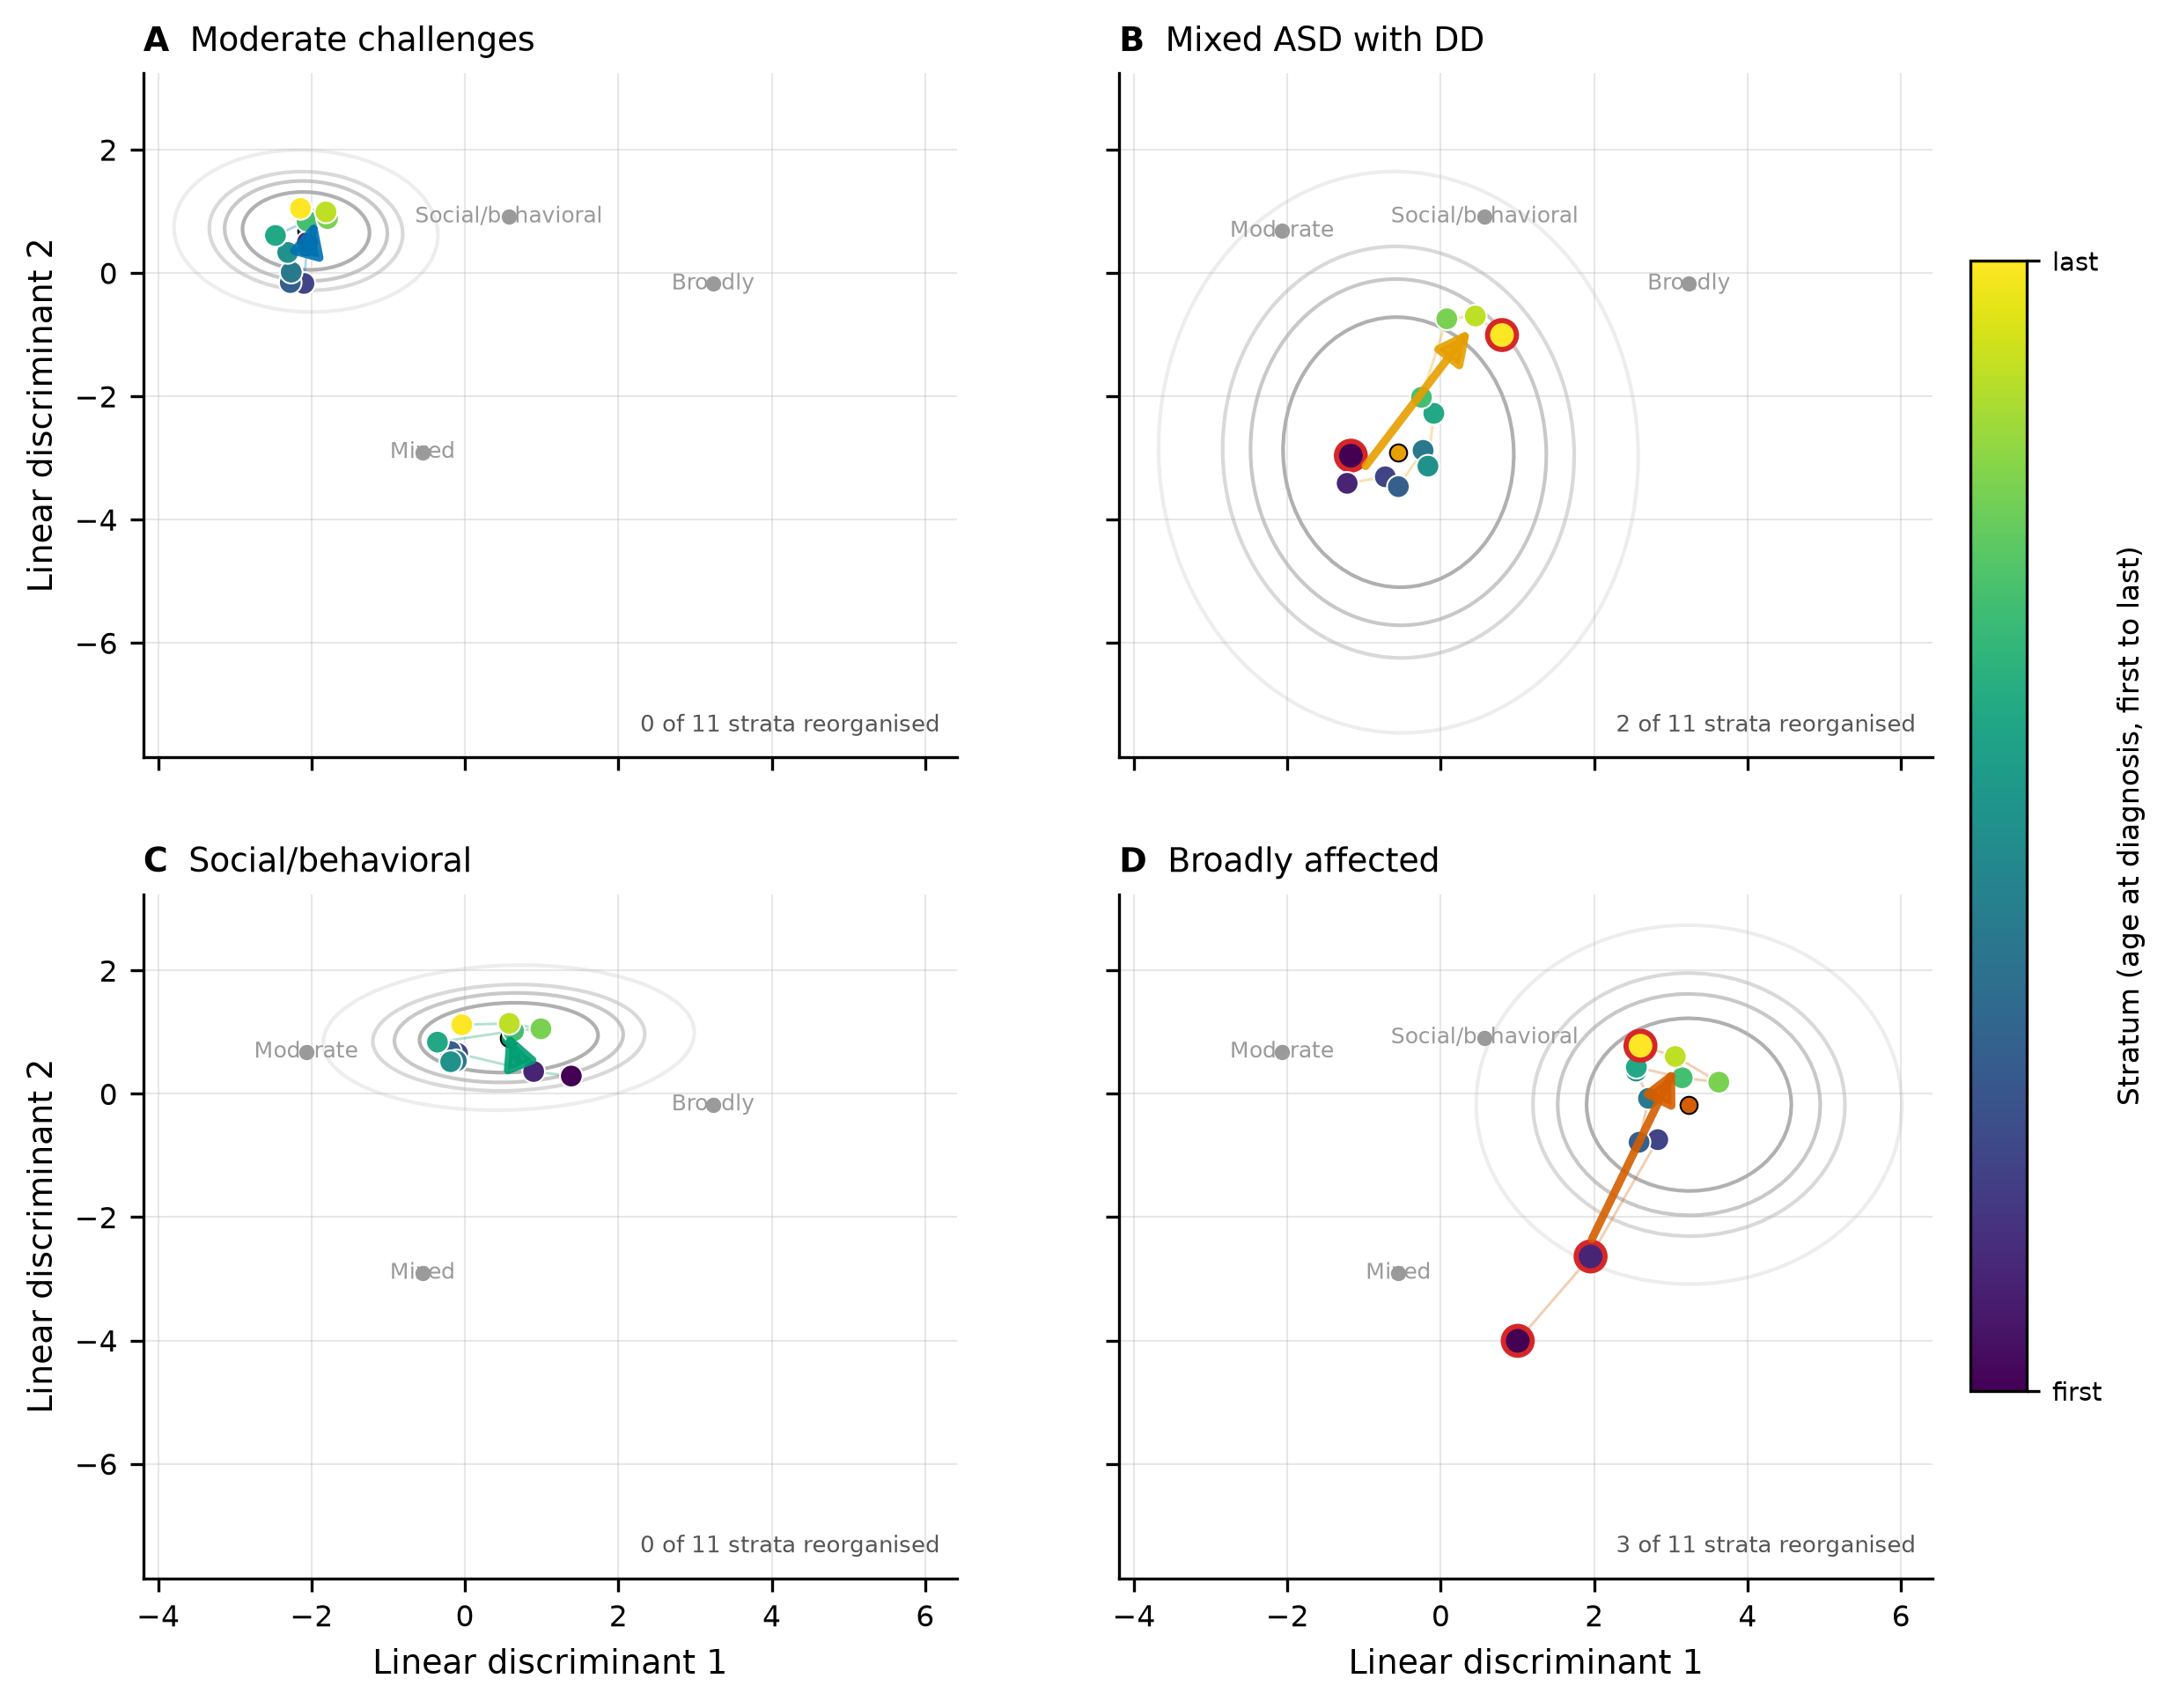
Class trajectories across age at diagnosis. One panel per class; the focal class is drawn as grey coverage contours, the others as their centroid. Stratum centroids run youngest to oldest, a red ring marks a reorganised stratum (Jaccard below 0.5), and the arrow is the net young-to-old displacement.#
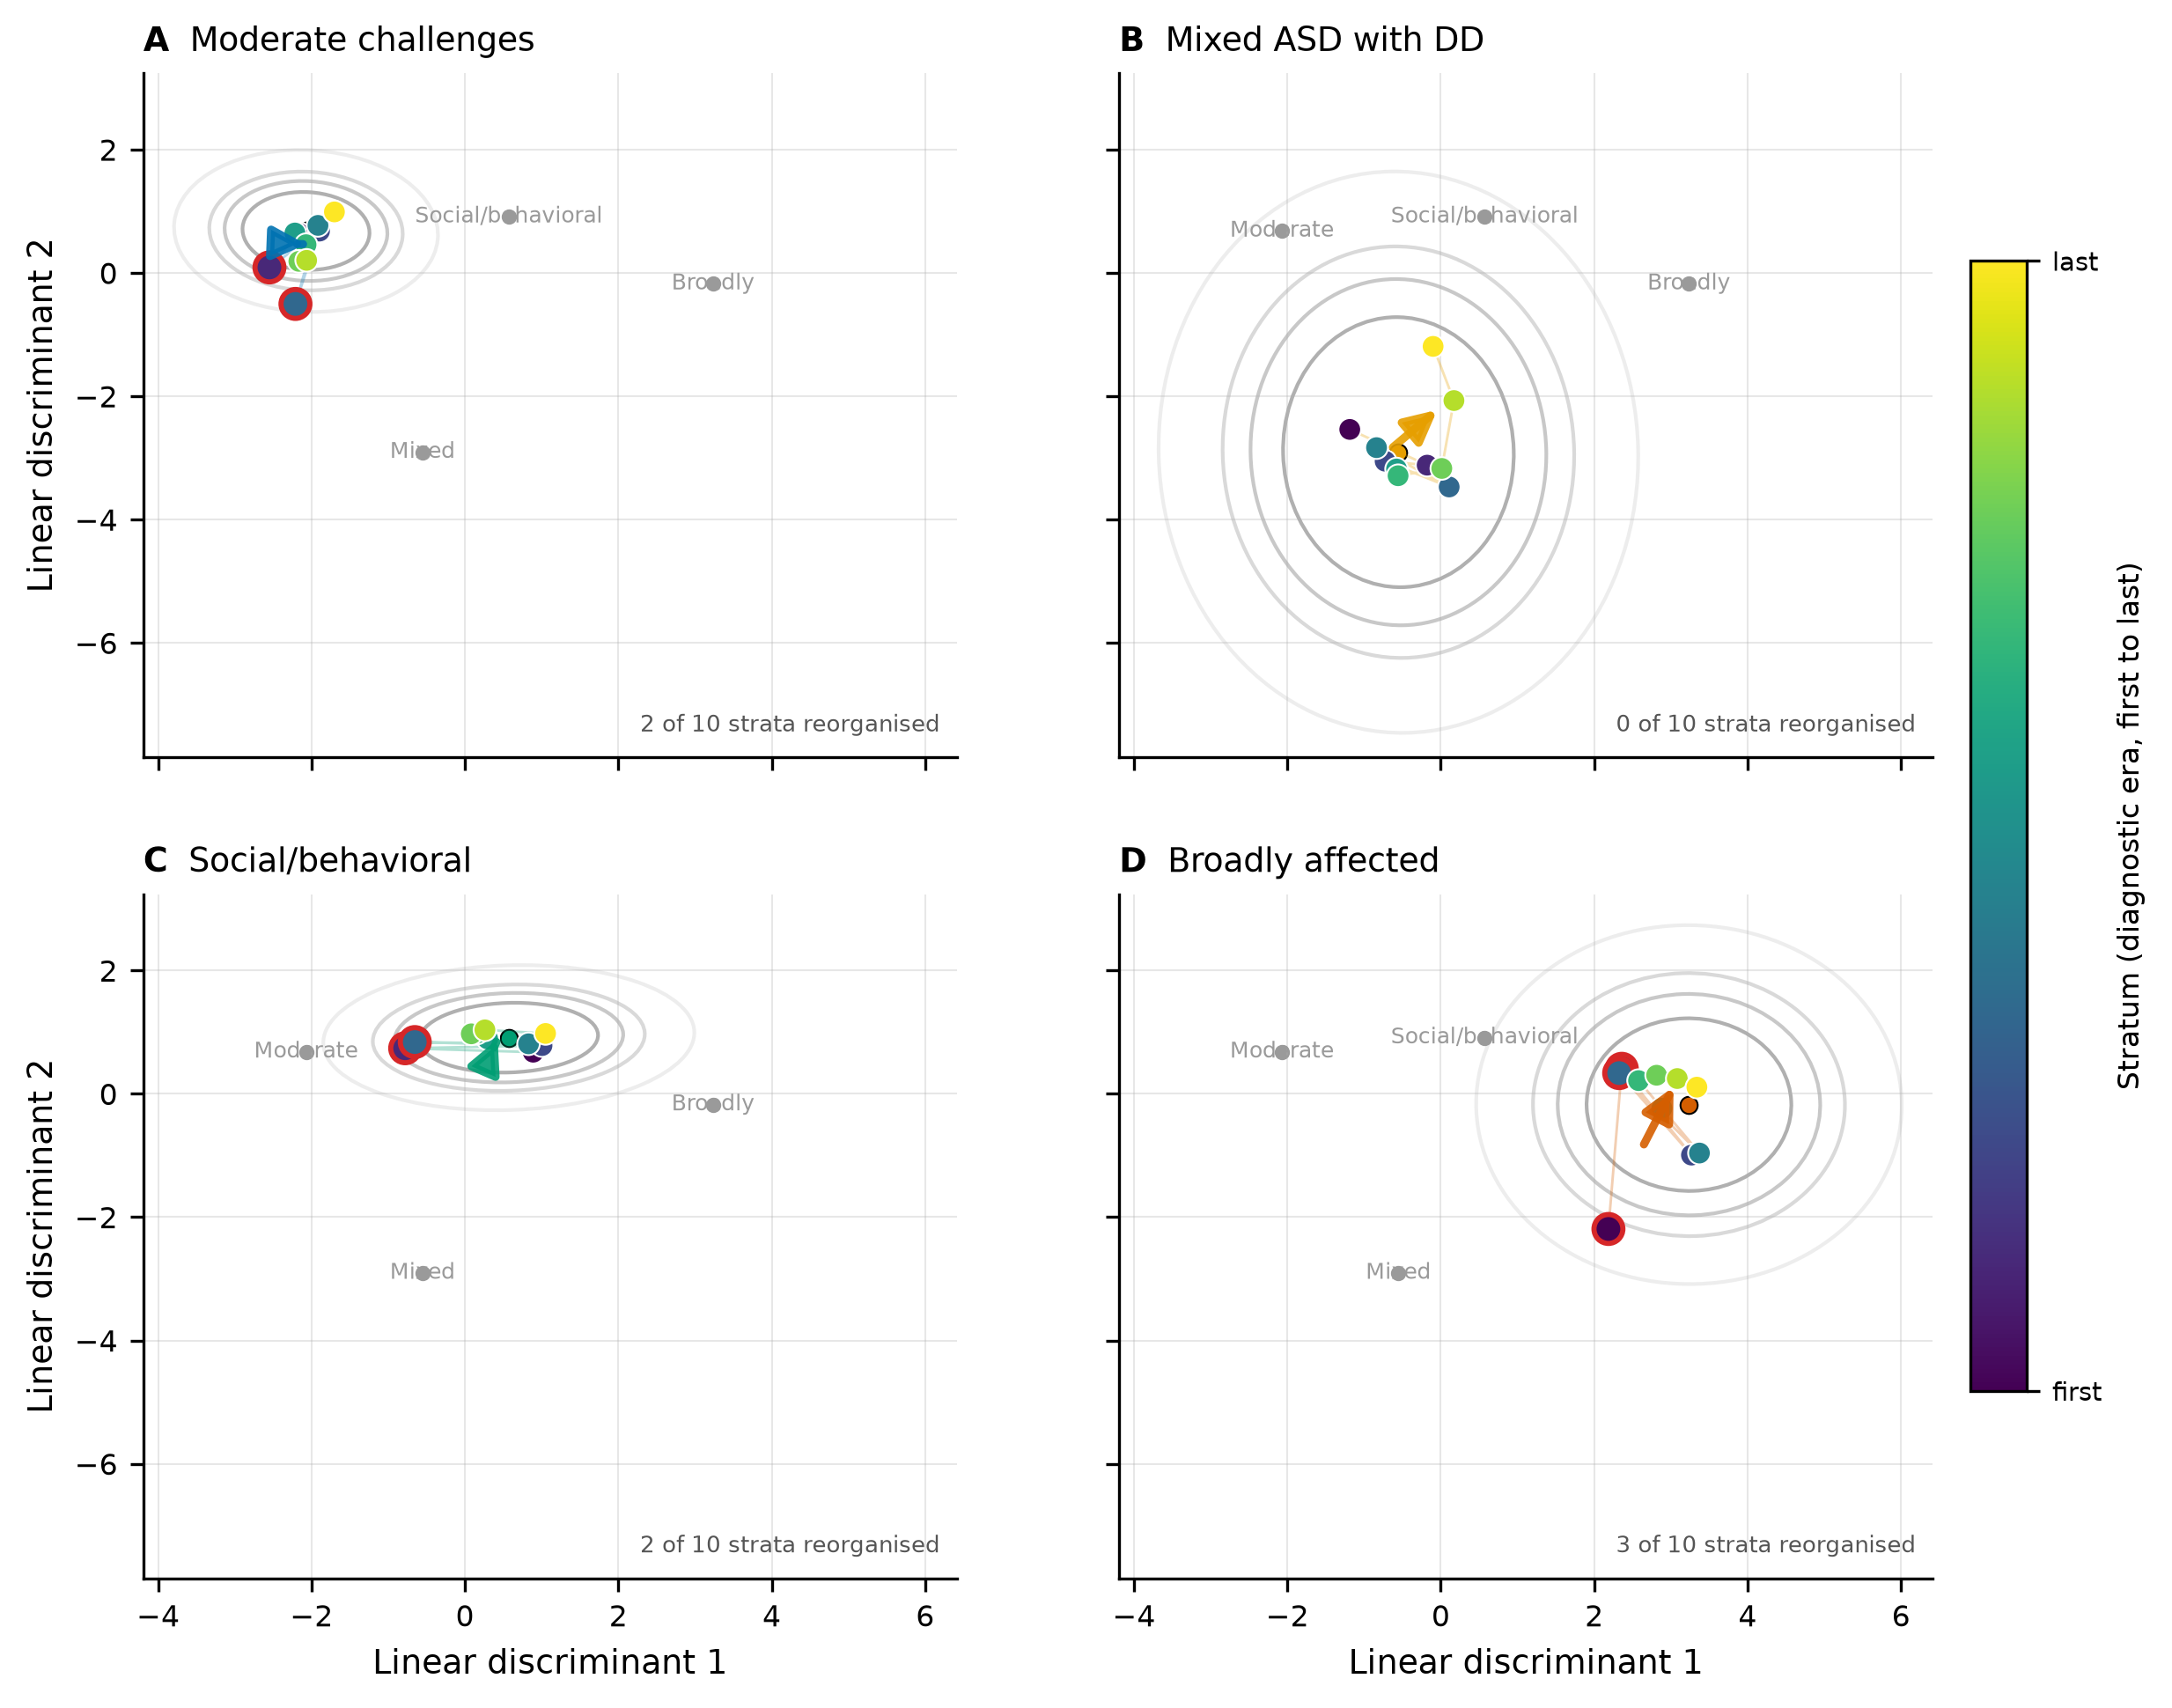
The same figure for diagnostic era. The projection is a discriminant embedding (its first two axes hold 54 and 36 per cent of the between-class variance), so it is an illustration; the claim rests on the full-dimensional statistics.#
How to read it#
Each panel fixes on one class: grey shading is where its probands sit, coloured dots are the same class re-estimated per stratum, youngest to oldest. A short tight run of dots is a class holding position; a long track is one that moves. A red ring flags a dot whose stratum class shares few members with the reference, so read it as a relabelling, not a move.
What it shows#
The two developmental classes trace the longest tracks and carry the red rings at the age extremes, where they both move and reorganise. Moderate challenges and Social or behavioral keep tighter tracks with no reorganisation. On era the tracks are shorter, and Social or behavioral barely moves.
Movement or noise#
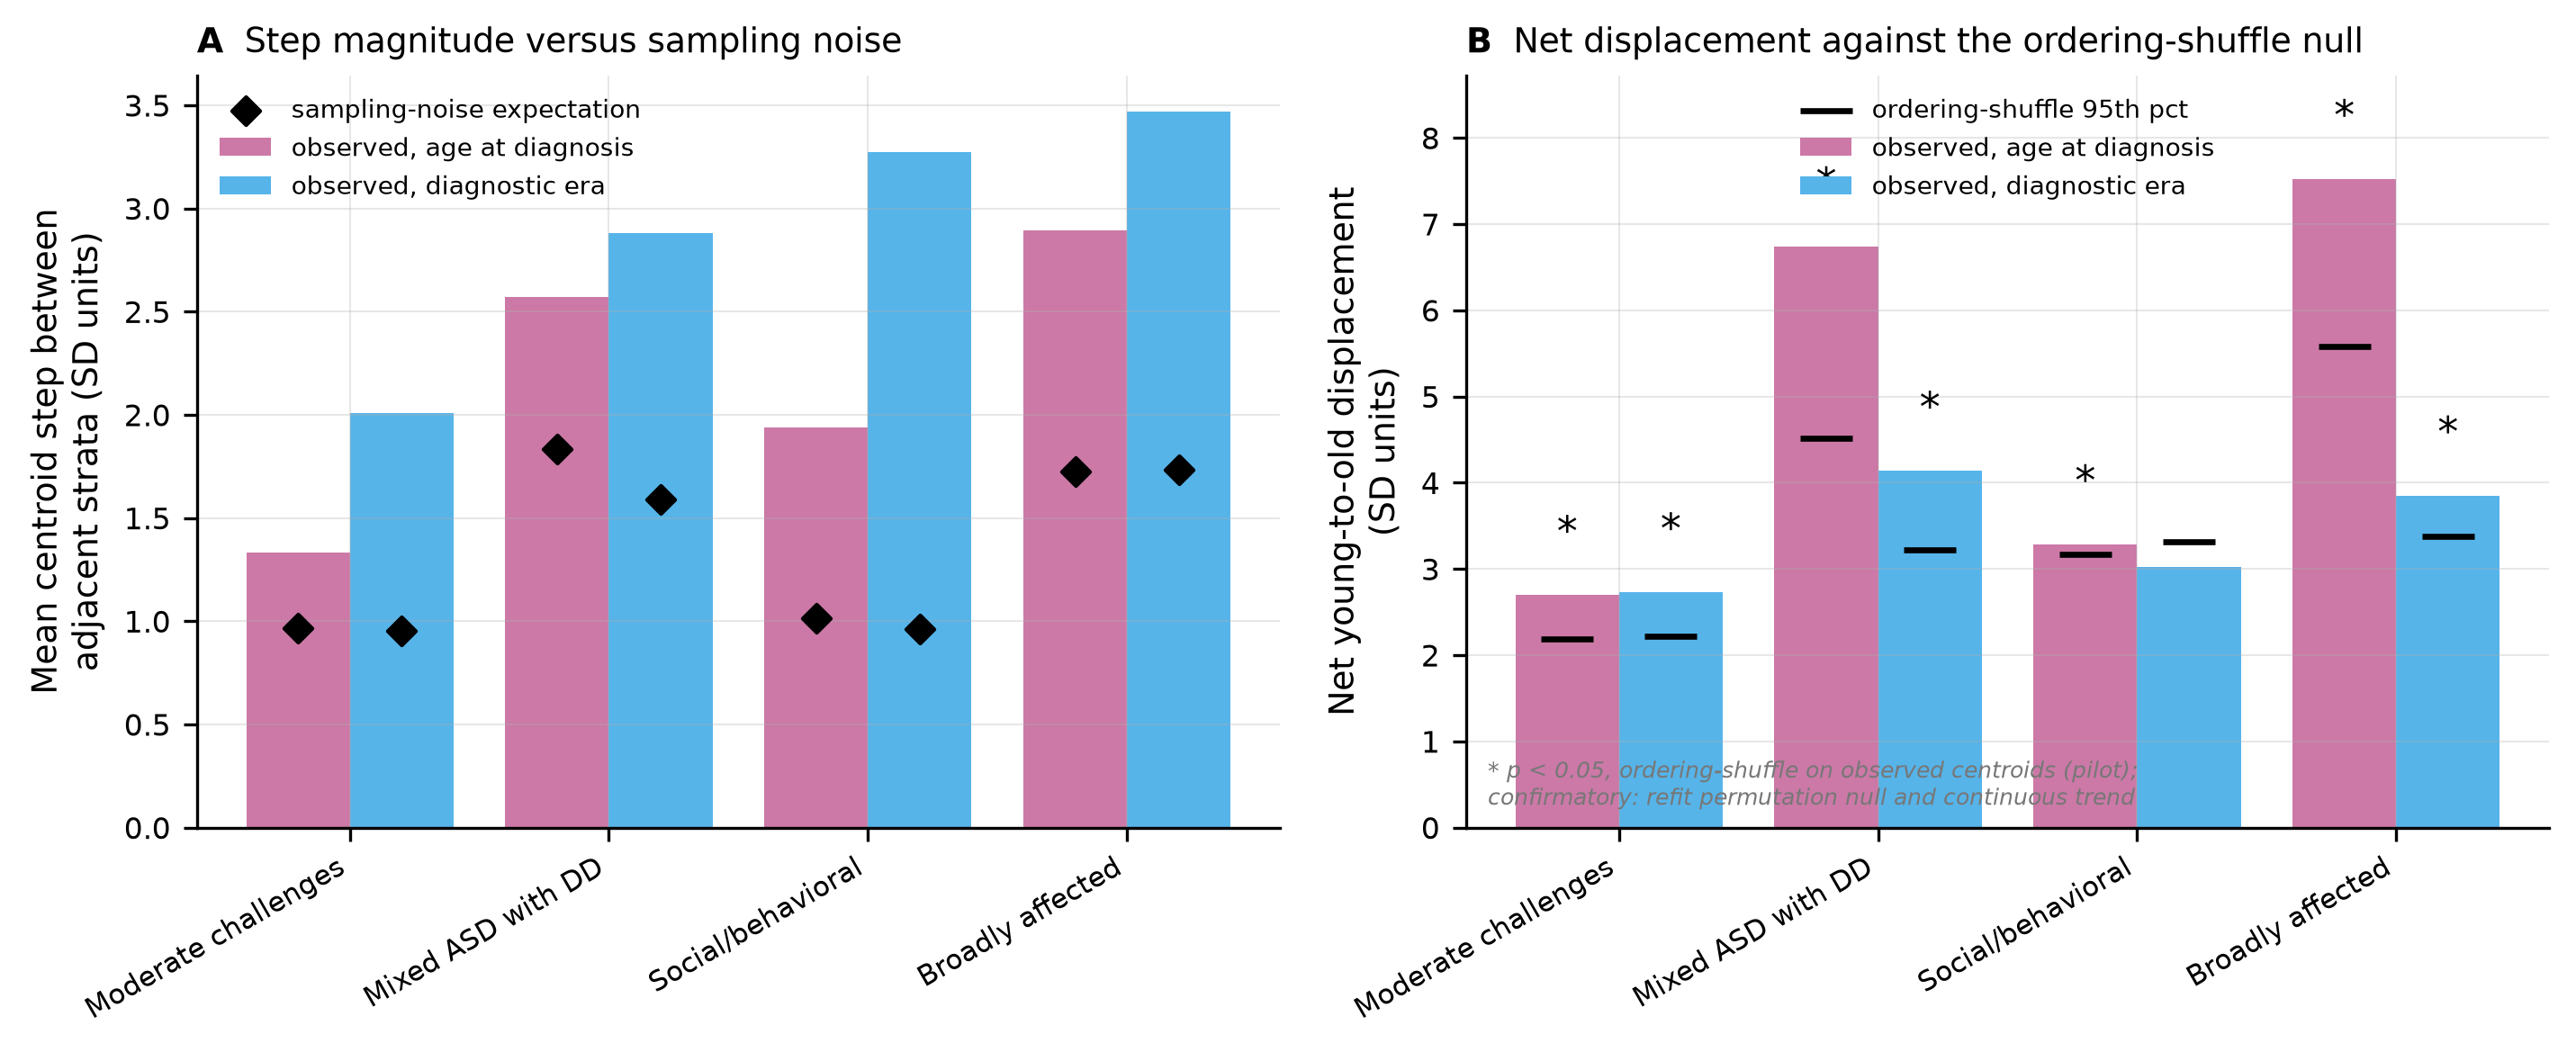
Roughness and directional movement, both axes. Panel A plots each class’s mean step between adjacent strata against the step that resampling a class of that size would give. Panel B plots its net young-to-old displacement against the 95th percentile of an ordering-shuffle null.#
How to read it#
Panel A separates real step from sampling wobble: a point above the diagonal is a path rougher than a class of that size produces on its own. Panel B is the directional test: a bar past its marker is a displacement tied to the axis rather than to scatter.
What it shows#
Every class clears the sampling-noise line on both axes (step-to-noise 1.4 to 1.9 on age, 1.8 to 3.4 on era), so the paths are not just small-stratum wobble. The directional test is significant for all four classes on age, largest in the developmental classes (Mixed ASD with developmental delay 6.7 against a null of 4.5, Broadly affected 7.5 against 5.6, both \(p < 0.001\)), and for three on era. Social or behavioral is the smoothest path with the least directional pull, and on era does not clear its null (\(p = 0.086\)).
What carries the movement#
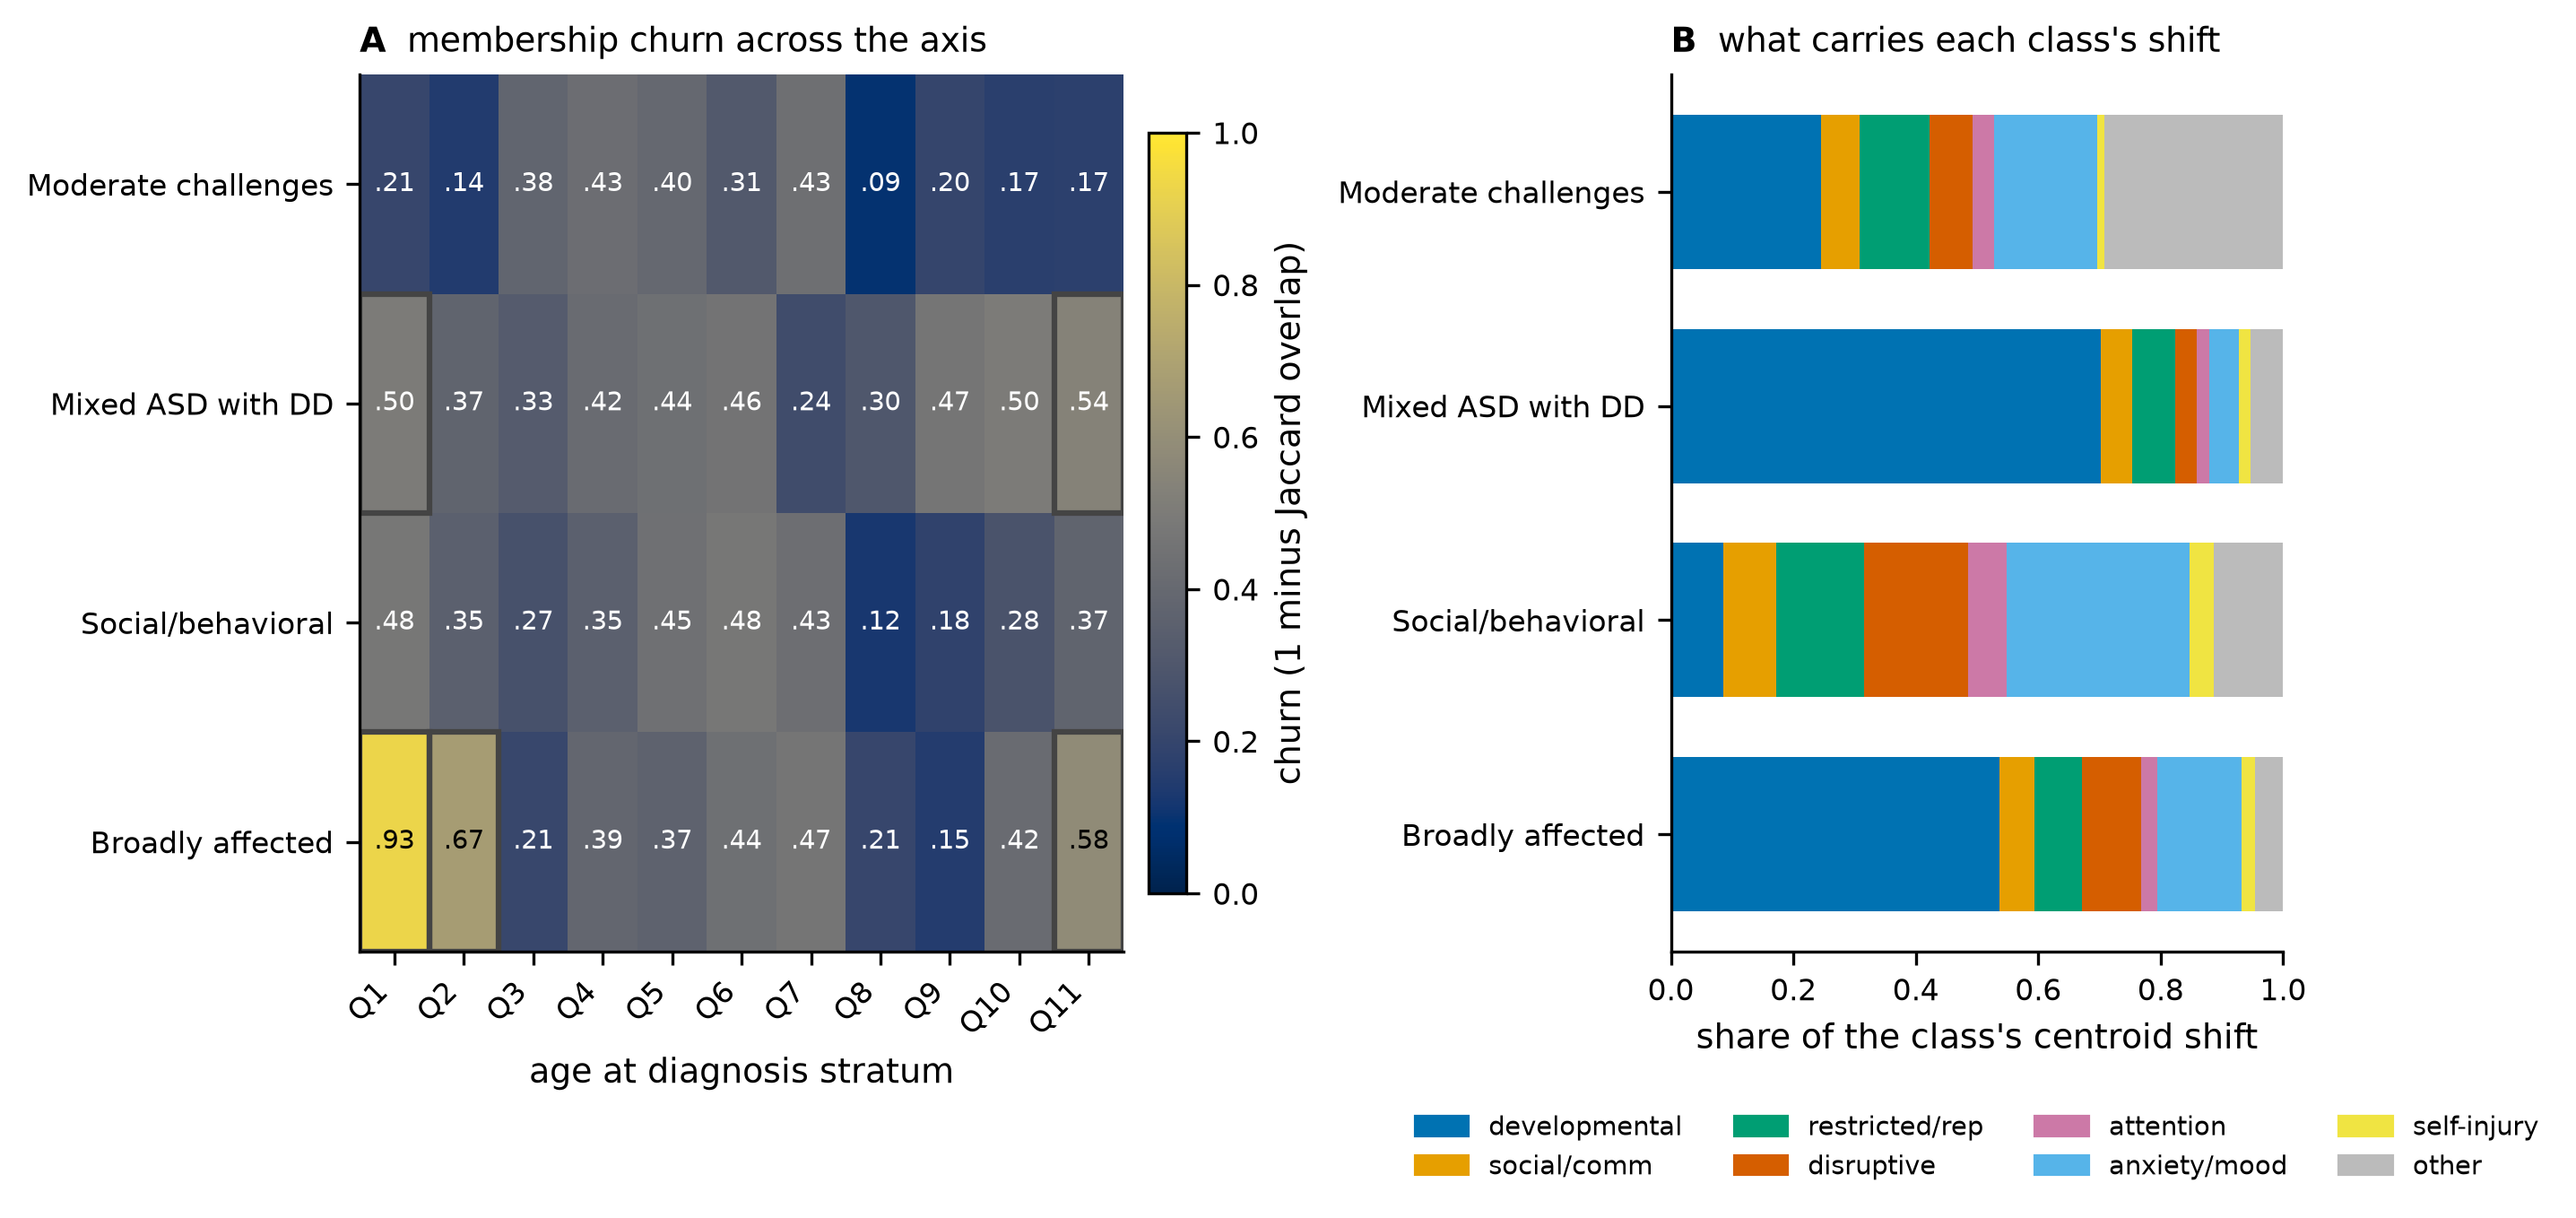
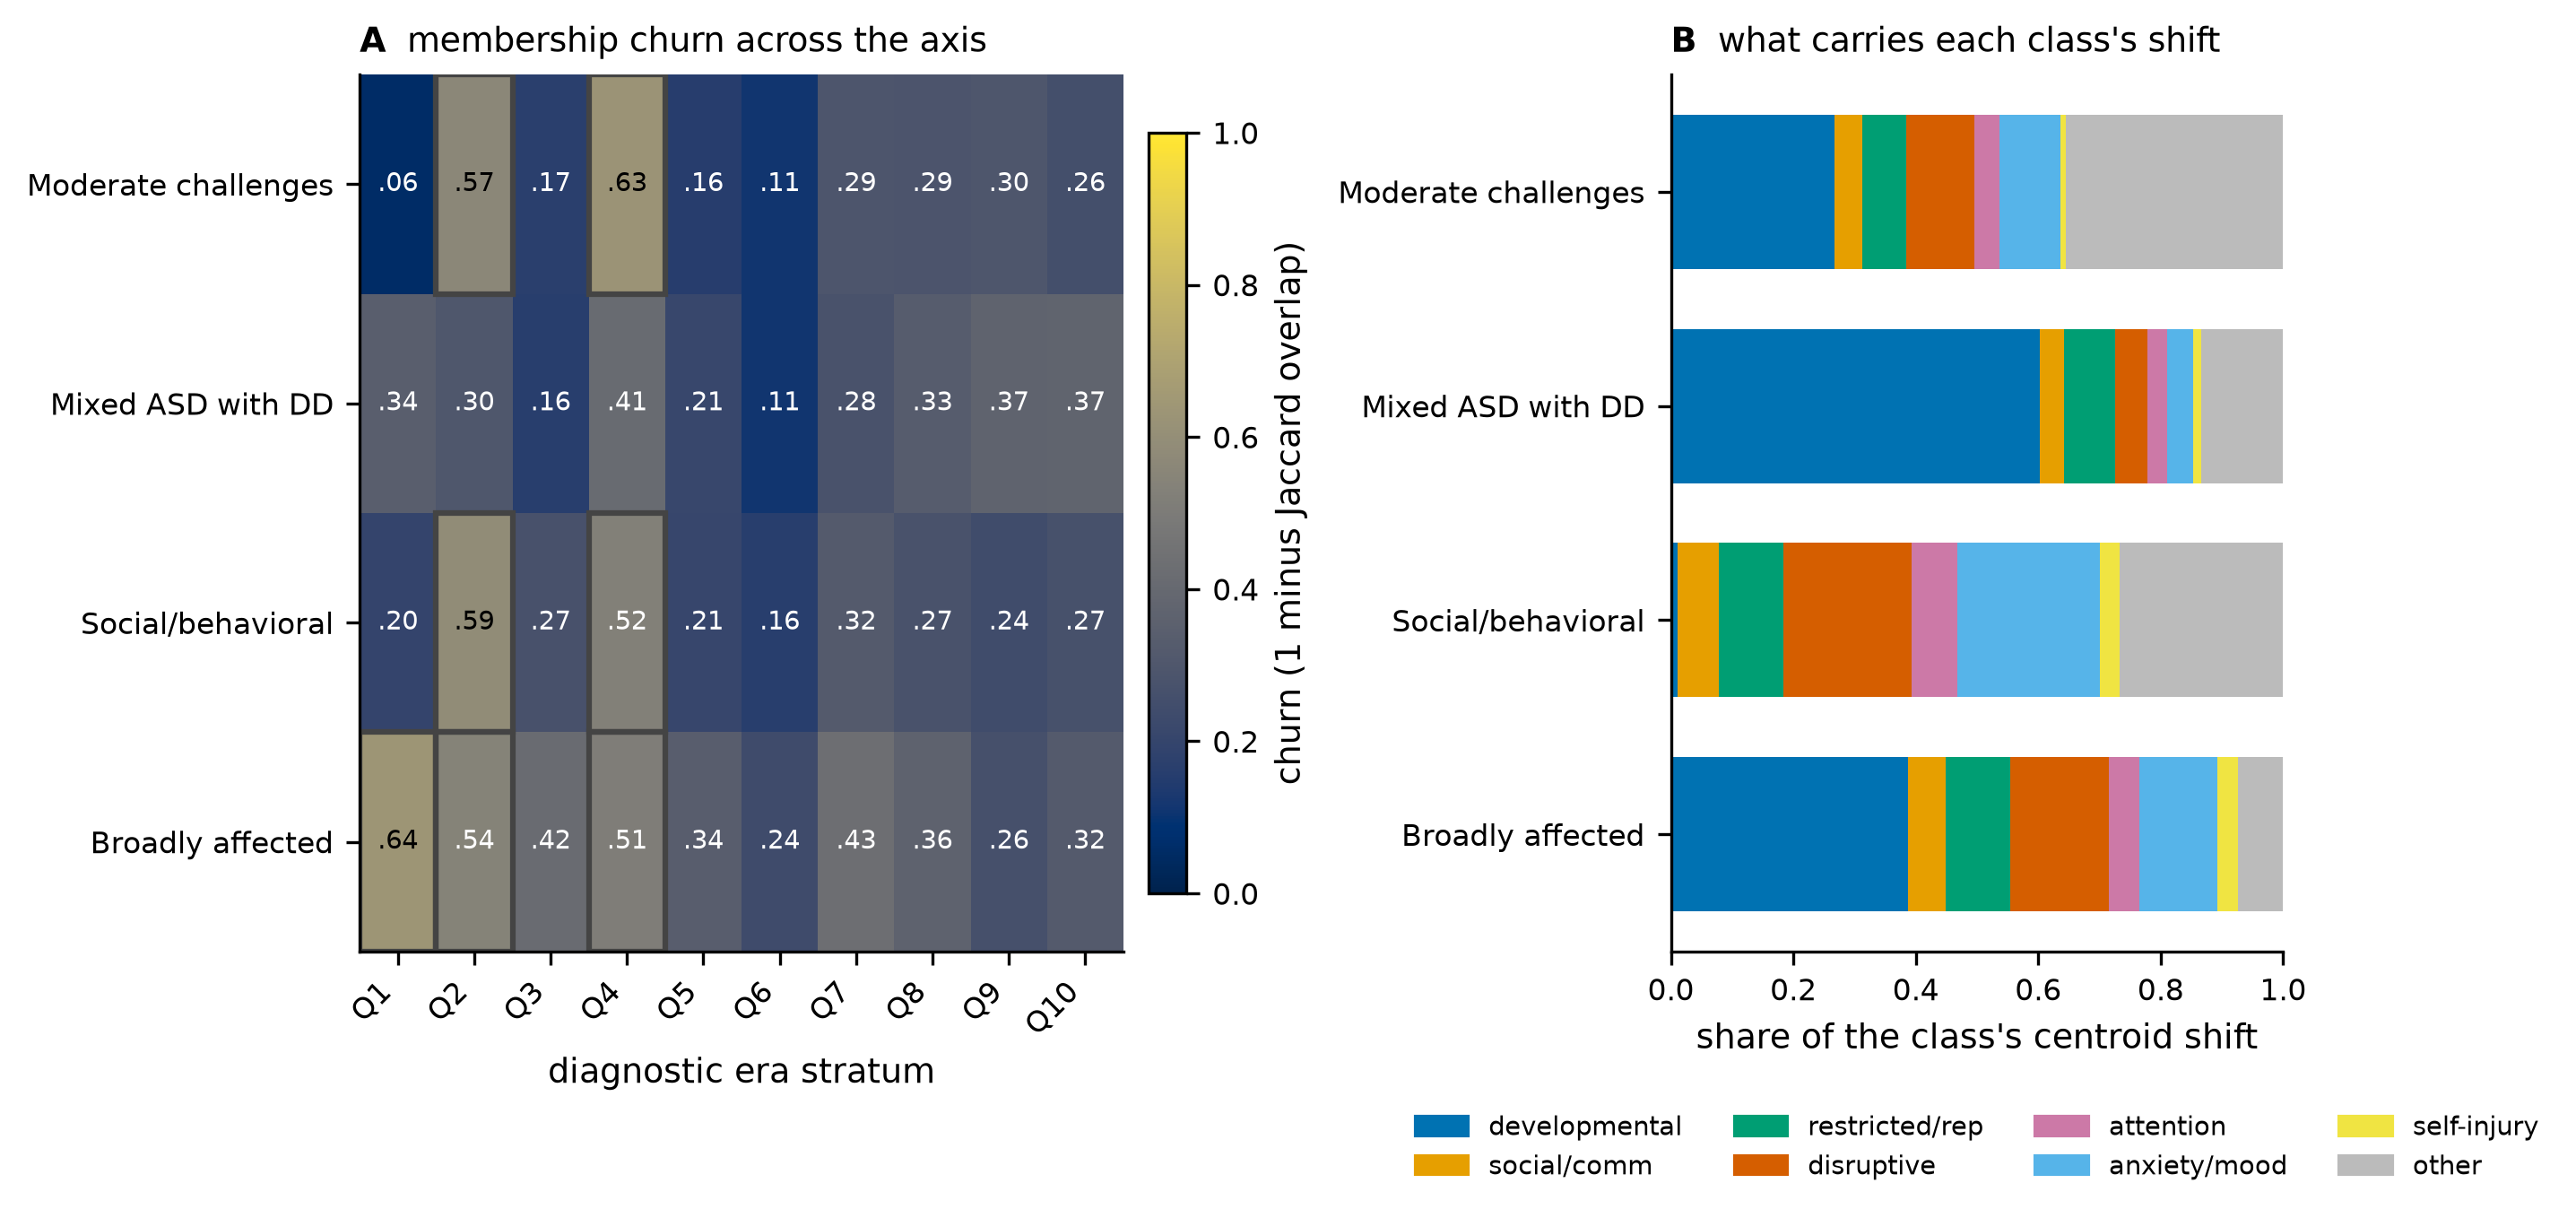
Movement attribution, age at diagnosis. Panel A is a heatmap of churn (one minus the Jaccard overlap) per class and stratum, boxed on the reorganised cells. Panel B stacks each class’s centroid shift by literature category, pooled across strata.#
The same decomposition for diagnostic era.#
How to read it#
Panel A maps where each class turns over its membership; a dark cell is high churn, the boxed cells are the reorganised ones. Panel B splits each class’s total shift across the seven categories plus the composite features outside them, so a tall developmental segment means the class moved on its milestone items.
What it shows#
Mean churn is 0.37 on age and 0.32 on era, darkest at the extremes. The category split separates the developmental classes from the rest: Mixed ASD with developmental delay and Broadly affected move mainly on the developmental category (pooled 29.9 and 25.5 on age, far above any other), Social or behavioral on anxiety or mood, Moderate challenges on the composite features. The movement is concentrated in the developmental and milestone features, not spread across the phenotype.
Who moves#
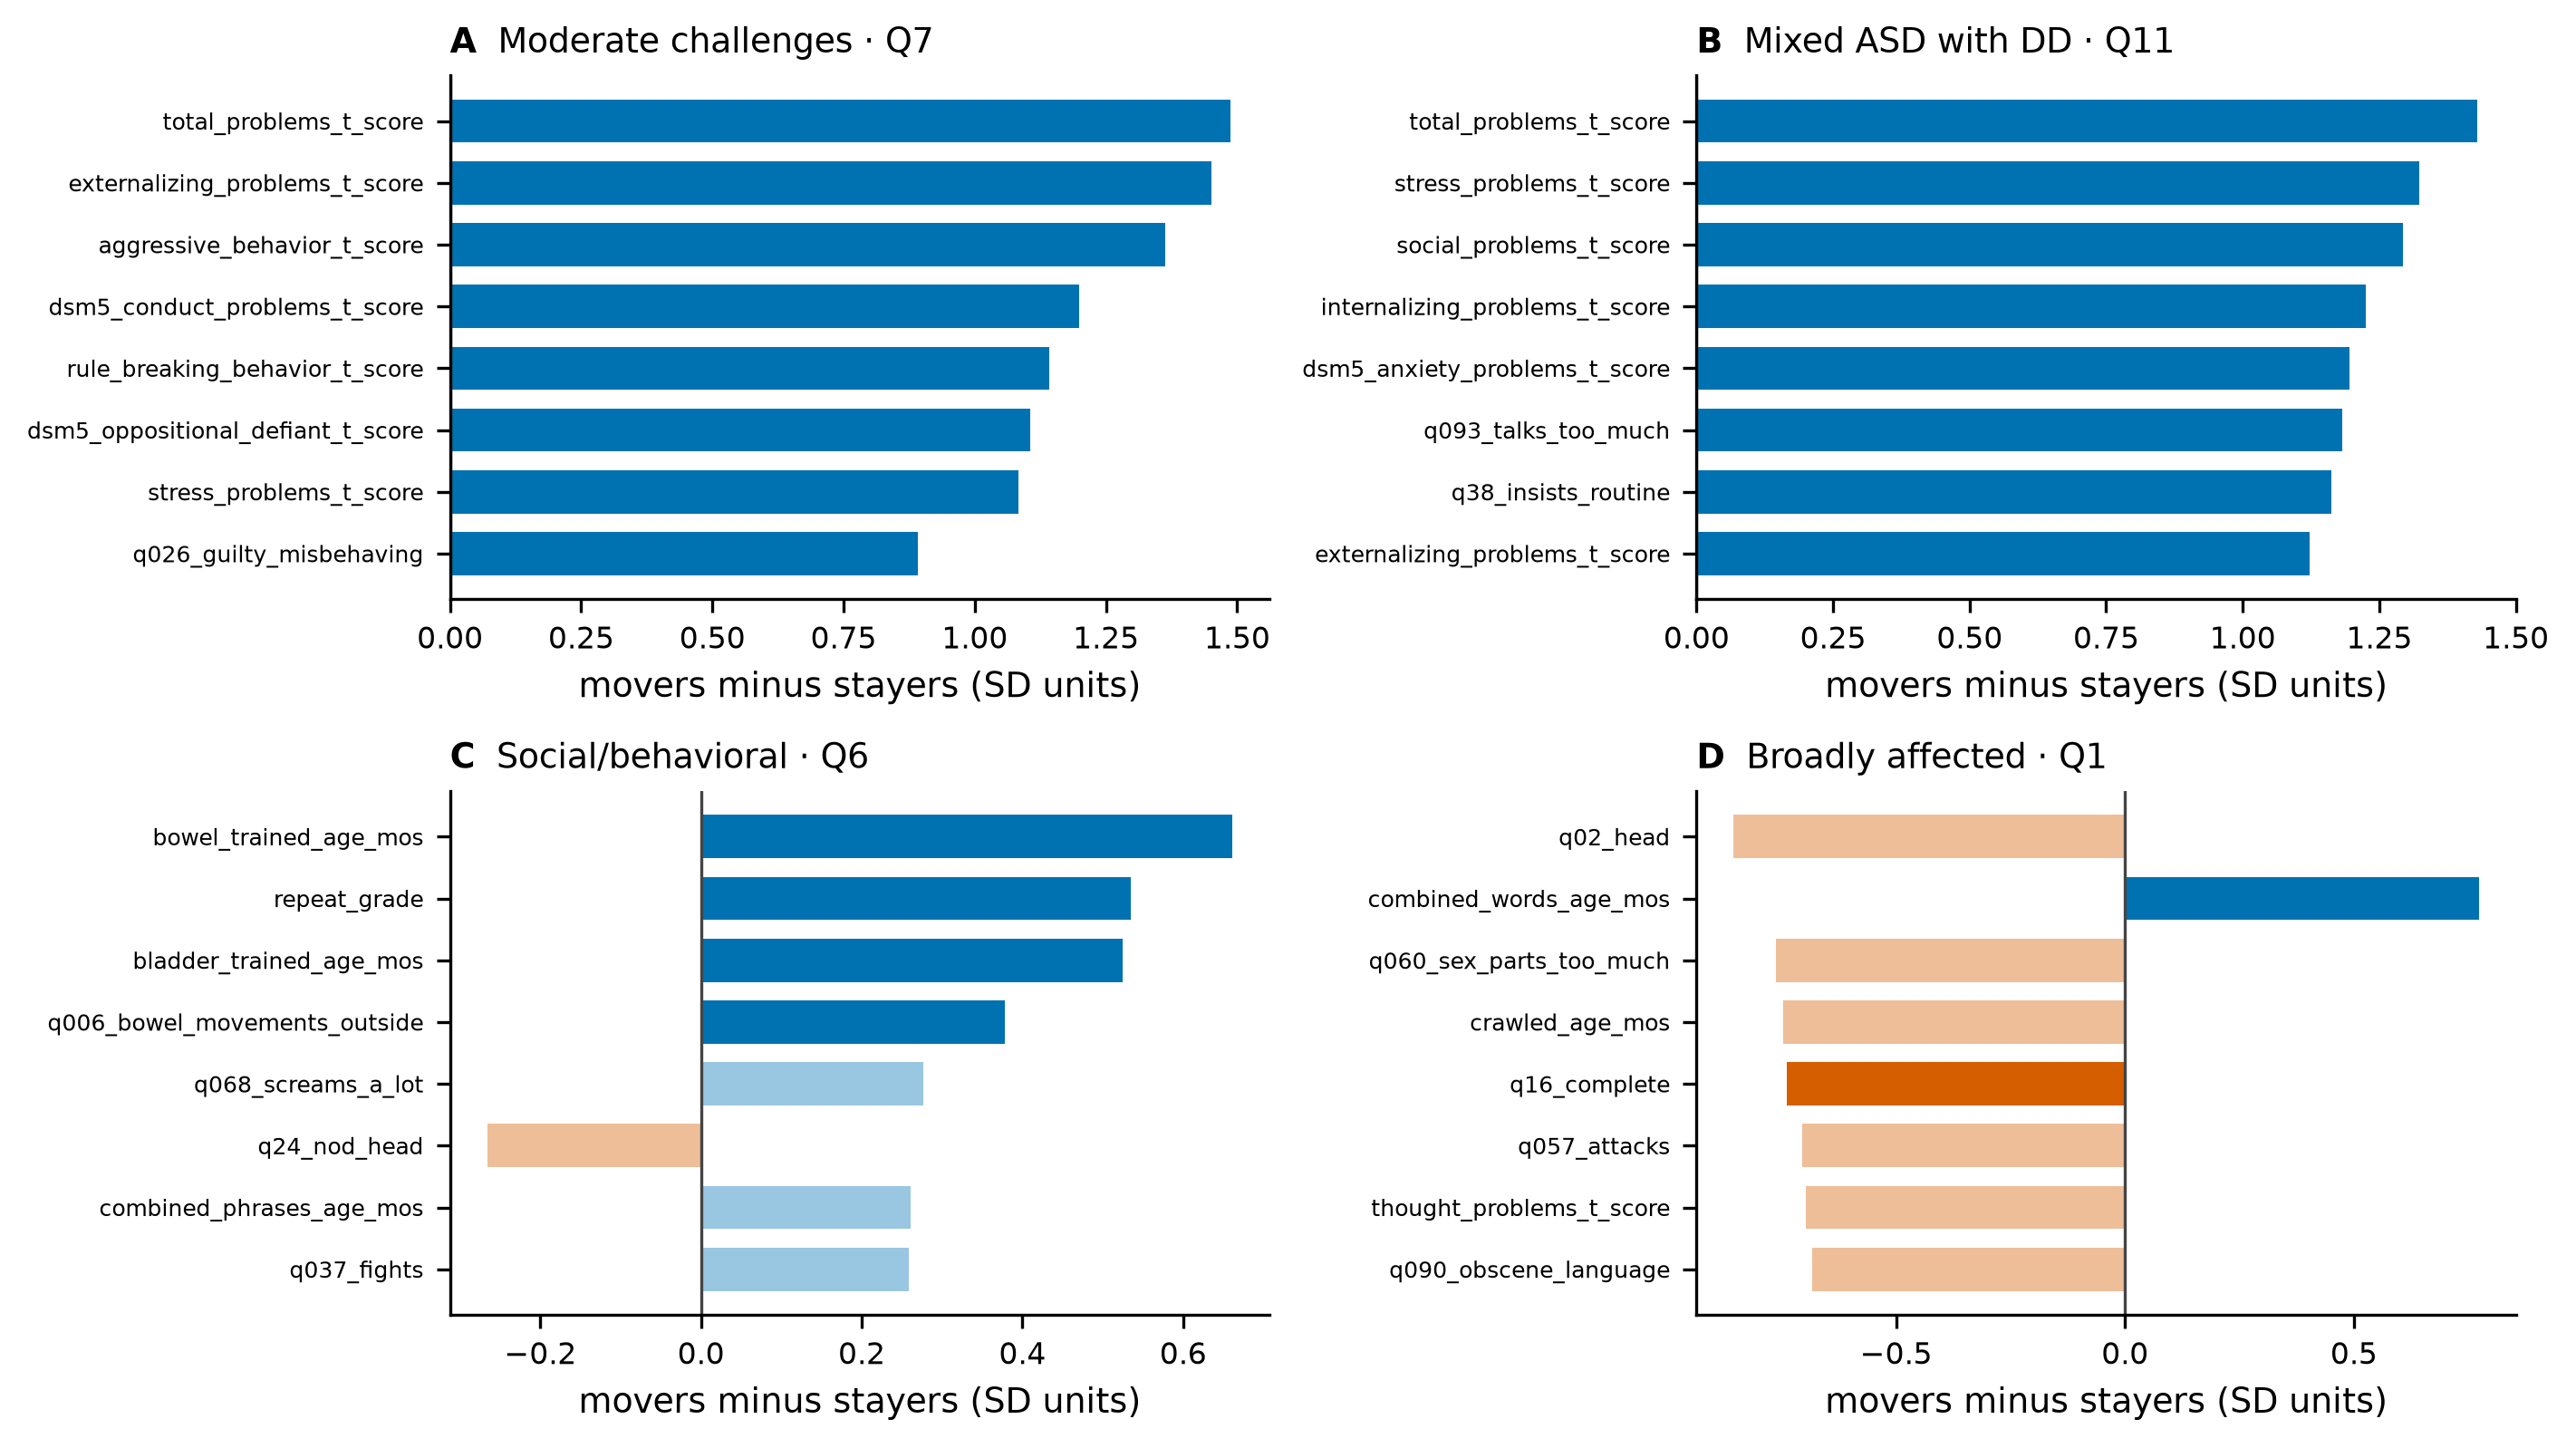
The mover contrast, age at diagnosis. One panel per class, at its peak-churn stratum; each bar is a signed standardised mean difference between the probands that left the class and those that stayed.#
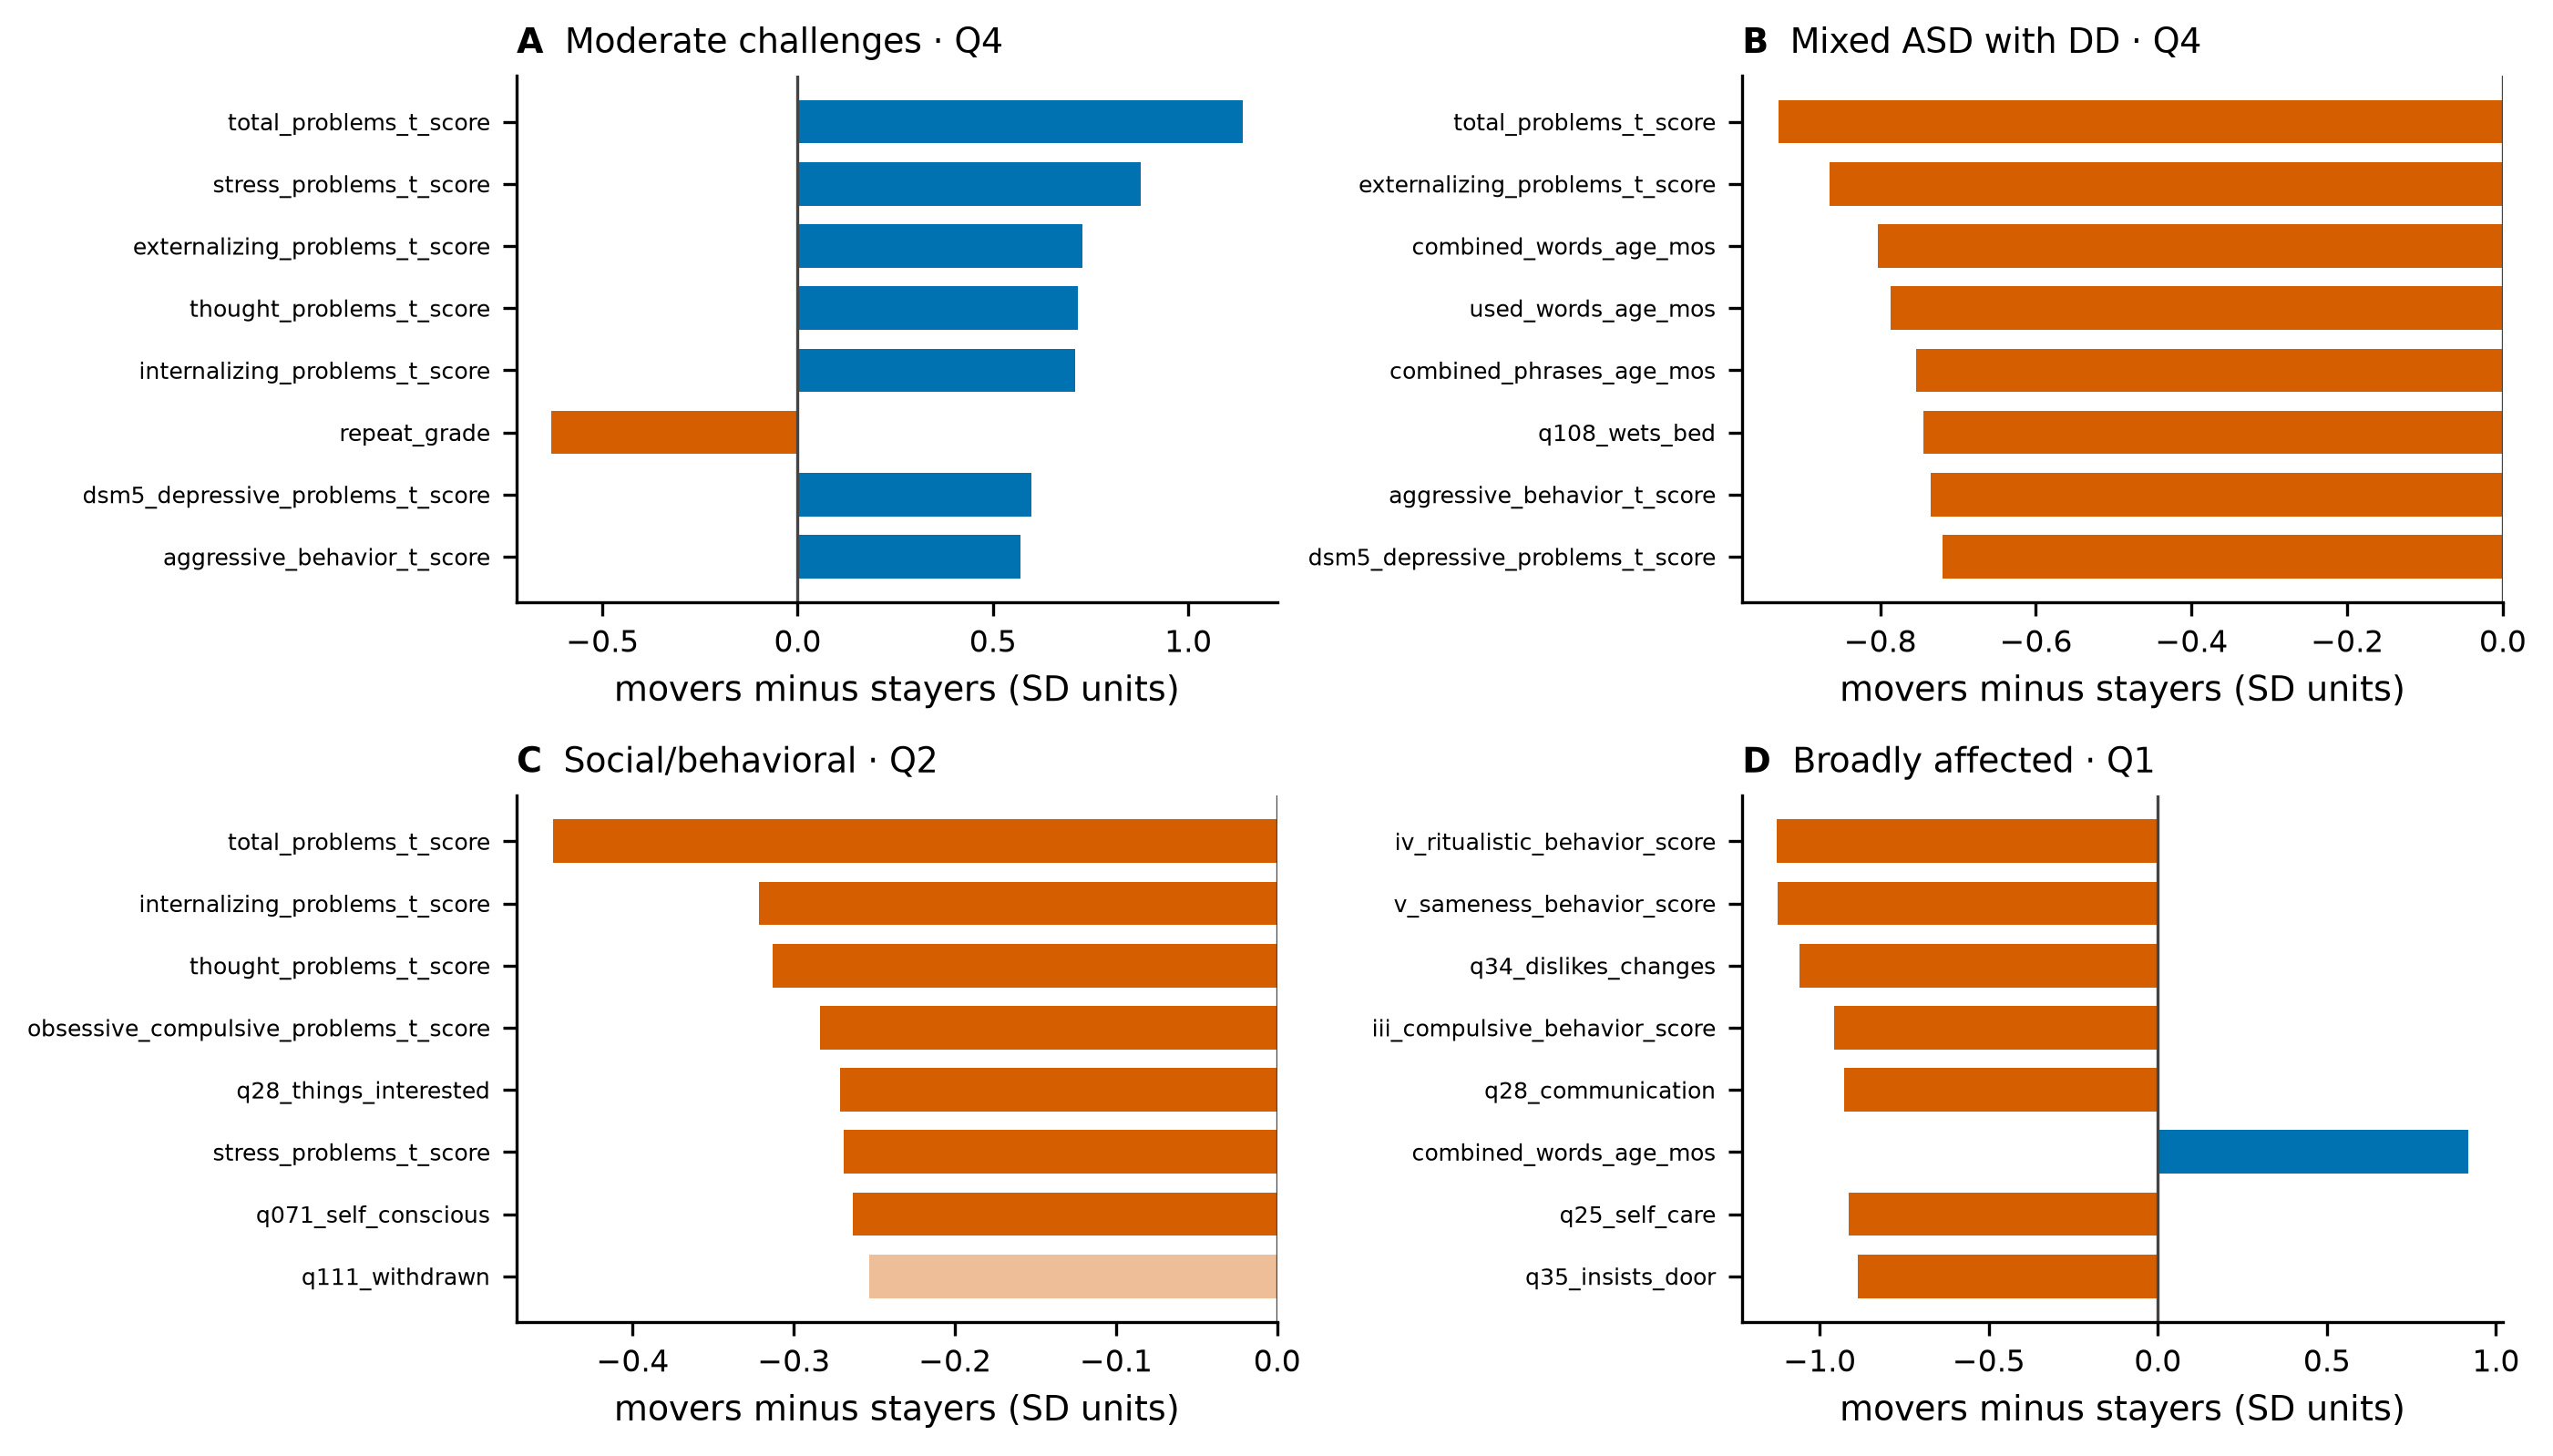
The same contrast for diagnostic era.#
How to read it#
For each class this takes the stratum where it churns most, splits it into probands who left and who stayed, and ranks features by the standardised difference between the two. A large positive bar is a feature on which the movers score higher.
What it shows#
The recurring discriminators are the developmental milestones (age at combined words and phrases, age toilet-trained) and the broad CBCL problem scores (total, conduct, anxious or depressed), all Benjamini-Hochberg significant at each class’s peak-churn stratum. The probands who change class are the boundary cases whose milestone timing and problem burden sit between two profiles, the same ones the stability analysis found move between fits.
Limits#
This is a pilot. At one hundred permutations the smallest reportable p-value is about 0.01, so the Benjamini-Hochberg step across forty-odd tests has little room, and a class could drift without clearing it. The frozen confirmatory value is one thousand permutations. The pilot directional test also shuffles the observed centroids rather than refitting, so two checks remain: the binned result has to agree with the bin-free continuous trend that the kernel trajectory estimates directly, and the directional pilot has to give way to the refit permutation null. Both are the pre-registered next steps. For the mechanics behind each panel, see the guides on measuring how far a class drifts and attributing a class’s movement.