Stability under refitting#
The question
Does the four-class solution survive re-initialisation and resampling, or is it an artefact of one fit, one random start, or one sample? Mixture-model fits depend on their random start, so this investigation refits many times, from different seeds and on random halves of the cohort, and compares each fit back to the named reference.
The result
The class profiles are stable; the membership is softer at the edges. The seven-category profile reproduces against the reference at a mean correlation of 0.91 across 100 re-initialisations and 0.92 across 50 random halves, and no fit ever collapsed a class (0 of 100, 0 of 50). The adjusted Rand index, which tracks individual proband assignment, is more moderate at 0.63 to 0.65: substantial agreement, not near-perfect, because probands near a class boundary move between fits.
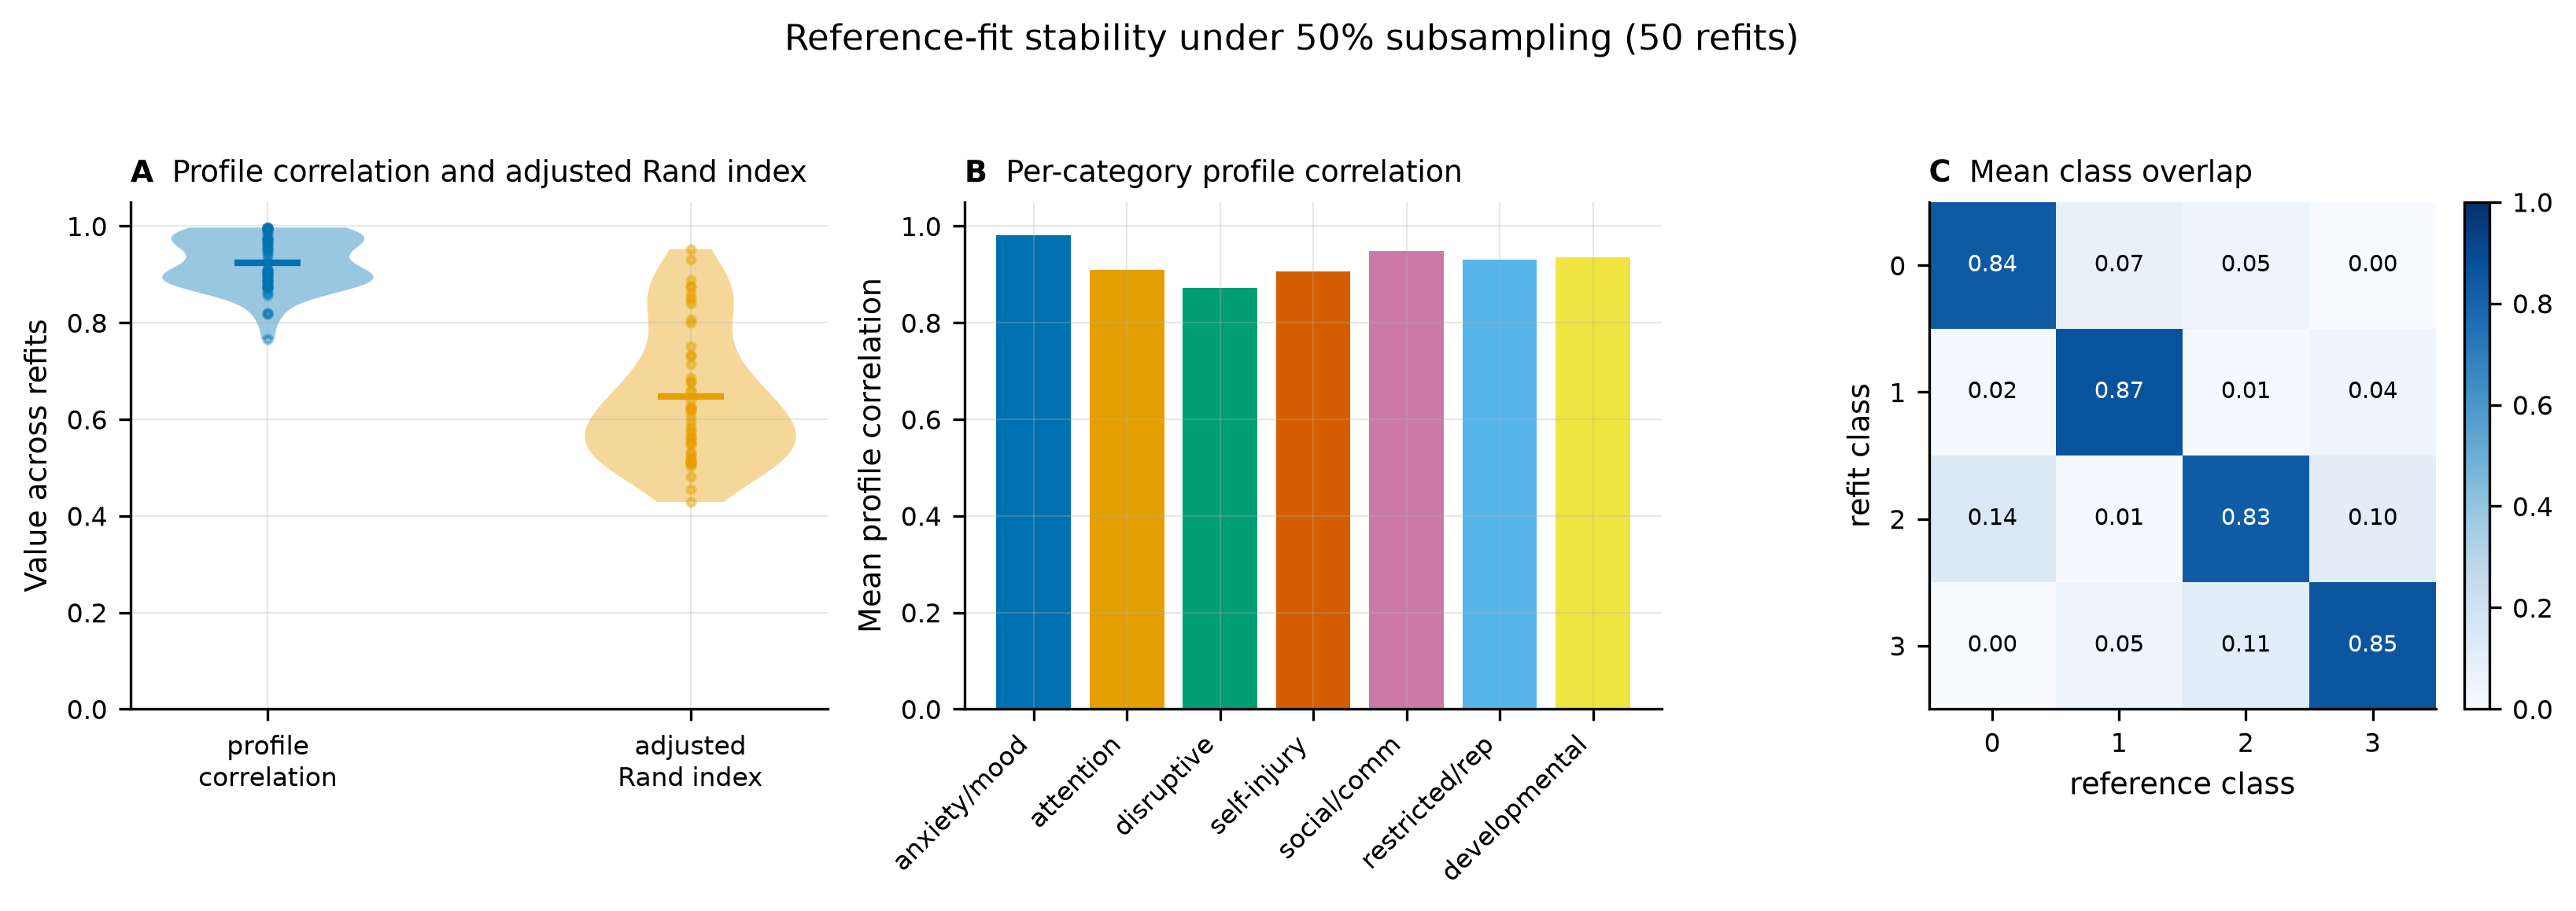
Stability of the reference fit under subsampling, from an analysis stability run (50 refits on
random halves). (A) The seven-category profile correlation clusters near 0.92, while the adjusted
Rand index is more spread, around 0.65: the class definitions reproduce, the proband-level
membership less so. (B) The per-category correlation is uniformly high, developmental included, in
contrast to its weaker cross-cohort replication. (C) The mean class-overlap matrix; its diagonal,
each class’s retention, runs from 0.83 to 0.87.#
Reading the result#
Both modes run on SPARK 2026-03-23 against the named reference fit. Multi-initialisation ranks 200 single-initialisation fits by log-likelihood and compares the best 100 to the reference; subsampling refits on 50 random halves of the cohort (about 5,850 probands each). The seven-category profile reproduces strongly under both: the mean overall correlation is 0.91 (standard deviation 0.09) across the multi-initialisation fits and 0.92 (standard deviation 0.05) across the subsamples. No fit collapsed a class in either mode (0 of 100 and 0 of 50), so the four-class solution is recovered every time.
The per-category correlations are uniformly high under subsampling, from 0.87 (disruptive behaviour) to 0.98 (anxiety or mood), with developmental at 0.94. Within SPARK, where every category is measured the same way as in the reference, developmental is therefore as stable as the rest. Its lower value in the cross-cohort SSC replication, 0.79, is not intrinsic instability in the class: there the developmental category rests on a reduced, milestone-only feature set and a correlation taken over the four classes alone, neither of which applies within SPARK.
The adjusted Rand index is more moderate, 0.63 (standard deviation 0.14) across the multi-initialisation fits and 0.65 (standard deviation 0.14) across the subsamples. It is chance-corrected, so 0 is the agreement expected at random and 1 is identical assignment; a value near 0.65 is therefore substantial agreement, not near-perfect. The two measures answer different questions: the profile correlation asks whether the class definitions reproduce, and they do; the Rand index asks whether individual probands keep the same class, and agreement there is only partial because probands near a class boundary move between fits.
Stable class profiles with softer boundary membership is the pattern a continuum with regions would produce: the regions (the profiles) are reproducible, while a proband sitting between two regions is assigned differently from fit to fit. This result does not decide between four discrete classes and a graded continuum with four regions; it shows the question is live, and it is one the planned sensitivity work tests directly, by comparing the four-class model against a lower-dimensional severity gradient. The reference classes are stable as structures, with membership that is softer at the edges.
How the fits are compared#
The comparison currency
Each stage compares a fitted solution to the named reference fit. The comparison currency is the seven-category signature from the reproduction stage: the signed proportion of each category’s features enriched minus depleted, per class. Two solutions of the same probands have their class labels aligned first, by the released greedy overlap rule, so that profiles are compared class for class.
The two stability modes
In its multi-init mode the stability stage runs many single-initialisation fits from
different seeds, ranks them by log-likelihood, and compares the best of them to the reference. The
released analysis runs 2,000 fits and reports the best 100; both counts are configurable. In its
subsample mode the stage refits on random halves of the cohort and compares each half back to
the full-sample reference.
How each fit is scored
Every compared fit is scored three ways. The seven-category profile correlation is the authors’ own measure. The class-overlap matrix records, for each reference class, the proportion of its probands that the fit places in each of its classes; after alignment, the diagonal is the retention of each class. The adjusted Rand index is added to these because it is label-invariant and chance-corrected, so it needs no prior alignment. The released code reports the profile correlation and the overlap; the Rand index is a deliberate addition.
Both stability modes are seeded and resumable; see the pipeline and its cache for the seeding and checkpointing, which are the one deliberate divergence from the released (unseeded) stability procedure.